Focus on Efficiency
Shorter days, cooler nights, and the dazzling colors of maturing crops can only mean one thing: Fall. Even though fall often conjures up the romance of rustling leaves and sweater weather, on the farm it signals that it is time for work. Chopping silage, harvesting crops, and fall fieldwork will soon transform these long nights into rather short ones for our midwestern farmers as they work to bring in what promises to be a well deserved (and hopefully not-too-wet) crop.
A farmer’s key to maintaining that profitability into the new year will be managing costs. That does not necessarily mean cutting costs, but absolutely does mean being as efficient with all crop inputs as possible. By definition: efficiency is getting the most output out of whatever is put into the crop. When we talk about crop inputs, by now everyone knows of the historic price increases that farmers nationwide experienced in fertilizer and fuel this past year. We are all familiar with the shortages that certain crop protection products and seeds were subject to. With high input costs and high grain prices, efficiency is more important than ever.
Starting this fall, our focus on efficiency will first be directed at fertilizer. And, as an input that can make up 1/3 to ½ of total variable costs of production, management here can make a large financial impact. To make the best use of that fertilizer input we will need to answer a few questions: What fertilizer should we apply? How much fertilizer should we apply? When and where should it go?
What seems like a simple question has a fairly complex answer since every field is different. At this point, technology like yield monitoring and satellite imagery have done a great job of painting a visual picture of the variability that exists within a field. The question always arises on “How best to address that variation in a meaningful way?” Luckily technology has provided us with several effective ways to address this.
Grid Sampling
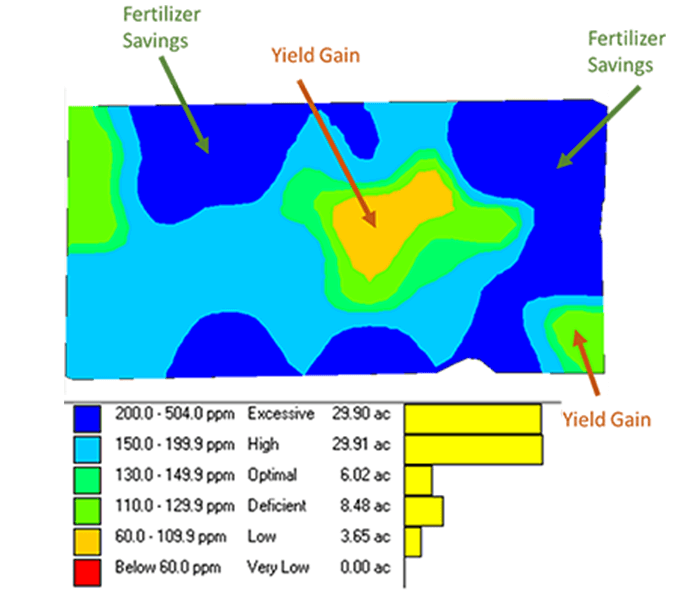
Central to the idea of highly efficient fertility management is grid soil sampling. As you know, a good soil sample is the basis through which all other fertility decisions are based. While composite soil samples are good tools, they are limited in their ability to describe the inherent variation as you move across a field. To better describe this variability, taking soil samples on a “grid” pattern will allow us to see changes in pH or fertility levels spatially. Most commonly, soil samples in a grid system are taken every 2.5 or 5 acres, however, they can be taken less frequently (up to 10 acres) or more frequently (as low as 1 acre) depending on the needs of the farm. From these digital soil test maps, we can create a fertility recommendation that treats individual areas of the field differently, applying more or less fertilizer to the soils where it is needed the most. In some instances after intensive sampling is done, total fertilizer requirements are reduced. In other instances, fertilizer requirements are not necessarily reduced, but moved around to areas of the field where they are “low” and not applied to areas that are “high”. Grid sampling is also very useful to assess where historic manure applications have built up the soil in certain areas of a farm and make it possible to apply fertilizer only to the areas that really need it. Lime needs are especially variable based on soil type. A farm needing pH correction will very likely require less lime to be applied where more intensive sampling is done.
Variable Rate Technology.
The counterpart to grid soil sampling is Variable Rate Technology (VRT). This is the actual digitization of data that is used to tell fertilizer application equipment where to spread a certain product. Maps generated by grid soil sampling are spread using VRT. However, VRT has some additional applications to fertility management as well.
-
Areas that received manure can be automatically excluded from application of fertilizer.
-
Historically higher or lower production areas can have different fertilizer rates applied; even in the middle of the same field.
-
Wet spots or areas around timberlines can be skipped or applications reduced.
-
Soil types can have different fertility recommendations.
Basically, by having digital data, we can create a fertilizer rec that will automatically be spread to whatever parameters we can dream up. The important thing to understand is that digitization of the data is a benefit, not a constraint, and allows us unlimited flexibility to spread exactly as we want it done.
Yield Data
When talking about fertilizer efficiency, don’t forget about yield data. It is one of the best (but least utilized) methods of determining where and how much fertilizer to apply. While yield data is pretty to look at, it’s also a perfect map of where your fertilizer was removed from a field last year. Using VRT, we can digitally create a fertilizer removal map from that yield data and then turn around and spread fertilizer back on the field from the areas it was removed. With this data, we can put fertilizer exactly where it needs to be… more in the higher production areas, less on the lower producing acres. Combine that with a good grid sample and we can skip entirely the very high areas of a field while putting a variable rate removal by yield on the rest.
These are just a few examples of how intensive sampling and VR technology can help guide nutrient applications on the farm. At the end of the day, it is a common sense approach to nutrient management that puts fertilizer in a position to do the most good where it is applied by using data effectively. With a little attention to detail, we can do a better job of making our fertilizer applications as efficient as possible in a time where high costs are going to put pressure on everyone’s budgets. Now more than ever we need to be confident that where and how much fertilizer we are applying is going to help our bottom line. I believe that starts this fall with a good soil sample program. Now is the time to be discussing with your agronomist what that program looks like.
With a good plan in place now we will be ready for those long days in the fall. Safe Harvest.


